Born Below the
Future Sea
A child born in the Pacific today will inherit a different ocean tomorrow.
Meet Litia
In 2024, Litia was born in a coastal village in Fiji. She inherits a shoreline in flux, though she is still too young to understand thermal expansion, melting ice sheets, or rising greenhouse gas emissions.
To her, the ocean is a constant, reassuring presence. It sustains her family, shapes communal stories, and lulls her to sleep.
Yet, the sea around her home has already risen significantly since her parents took their first steps on these shores. By the time she reaches adulthood, this change will have accelerated.

Precision satellites begin continuous measurements, establishing a reference point zero to track changes across the globe.
Standard reference point zero for all modern sea-level rise observations.
The 1993 Baseline
In 1993, high-precision satellite altimetry began recording global sea levels, establishing a baseline of zero deviation.
For generations, the shorelines of Fiji, Samoa, and Tuvalu had remained relatively stable, with seasonal tides gently sculpting the shores.
Three Decades of Change
Precision satellite altimetry begins, establishing a 0.0 mm reference baseline to launch a continuous global record of sea-level change.
Not All Islands Rise Equally
The ocean does not rise evenly like water in a bathtub. Due to Earth's rotation, localized gravitational pull, prevailing currents, and wind patterns, water accumulates unevenly across different regions.
Some Pacific archipelagos experience localized sea-level rise at double or triple the global average rate. Islands like the Solomon Islands and Niue face rapid shoreline retreat, while others, like the Northern Mariana Islands, see comparatively slower rates of rise.
Because sea levels rise unevenly, climate adaptation cannot be a one-size-fits-all solution. Funding, coastal defenses, and migration planning must be tailored to the specific oceanographic pressures of each archipelago.
Growing Up With a Different Ocean
Drag the glowing scrubber left and right to inspect how the Fijian coastline has changed between Litia's parents' childhood (1993) and the flooded shores she inherits today (2024).

Stable Shorelines
Coastal villages enjoyed wide sandy beach barriers. Strong vegetation stabilized the shoreline, and groundwater wells remained clean, nourishing homes and crops.
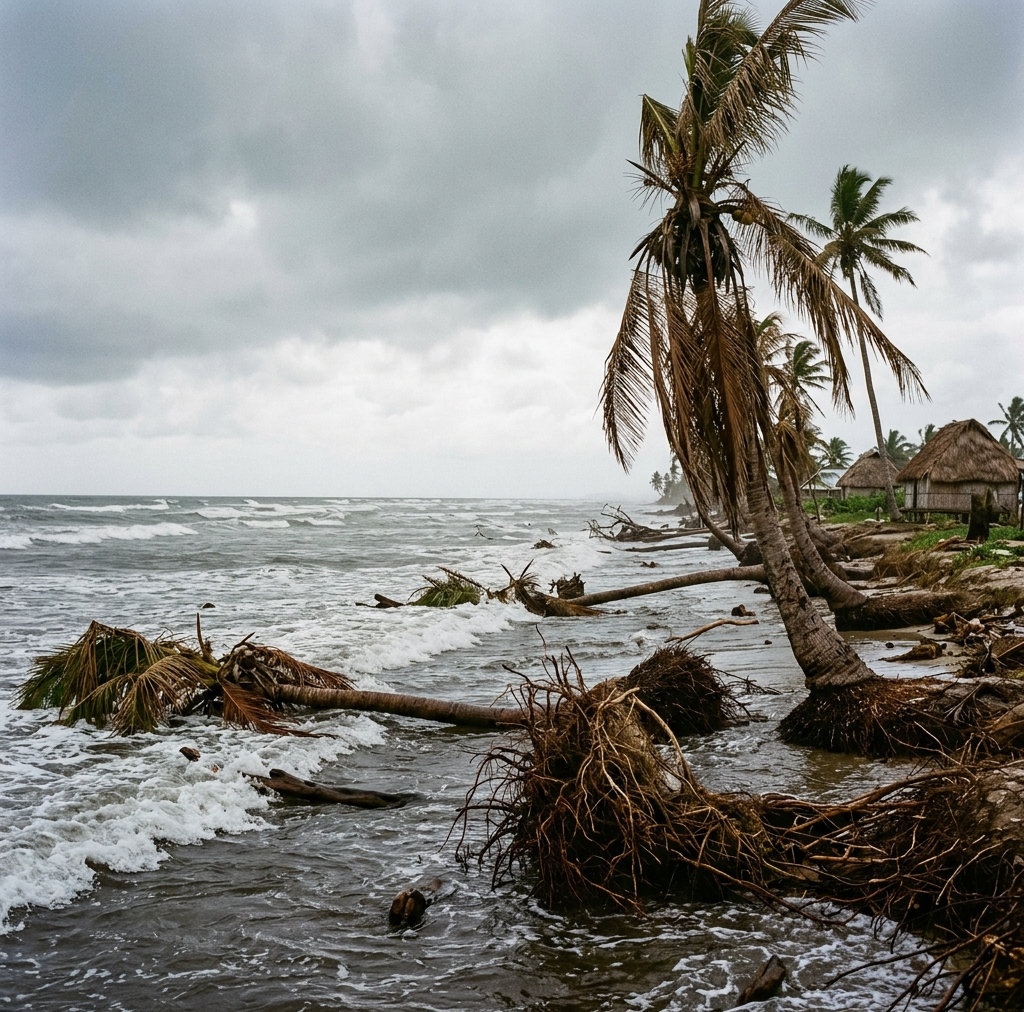
Encroaching Tides
Rising seas have aggressively swallowed the beaches. Salty groundwater kills coastal palms, ruins crops, and infiltrates drinking wells, threatening the village's very existence.
The Pacific Frontline
The nations of Oceania share a collective vulnerability to rising seas. Adjust the year and emission scenario to project the future of these islands. Click on any island circle on the map to select it for comparison.
Interactive Projection Timeline
Pacific Frontline
Select countries by clicking on them. Currently comparing Fiji (Red) and Tuvalu (Cyan).
The Data Behind the Story
High-precision satellite altimetry data provides the foundation for these insights. The visualizations below show the long-term regional sea-level trend alongside an interactive tool to compare individual island trajectories.
Pacific Regional Average Trend (1993 - 2024)
Hover over the chart area to inspect the exact millimeter rise recorded for any year.
Island Nation Comparison
Select two Pacific island territories below to inspect and compare their specific historical trends.
"The ocean rises a few millimeters every year."
For a child born today,
that sounds small.
Until those millimeters
become a lifetime.
Litia's Dilemma: An Unavoidable Future (2050)
By 2050, when Litia is 26, local sea levels in Fiji are projected to rise by more than 200 mm. Her village will face a stark, painful choice. Select a path below to explore the options.
Select a path above to explore the consequences of Litia's future...
Conclusion: The Choice to Fight
For indigenous Pacific Islanders, separating from their land is a form of cultural erasure. Many coastal communities choose to stay and defend their homes. They do not see themselves as passive victims of climate change, but as active guardians on the front lines of global resilience.